In vivo anti-CD3 induced cytokine release in rat or mouse
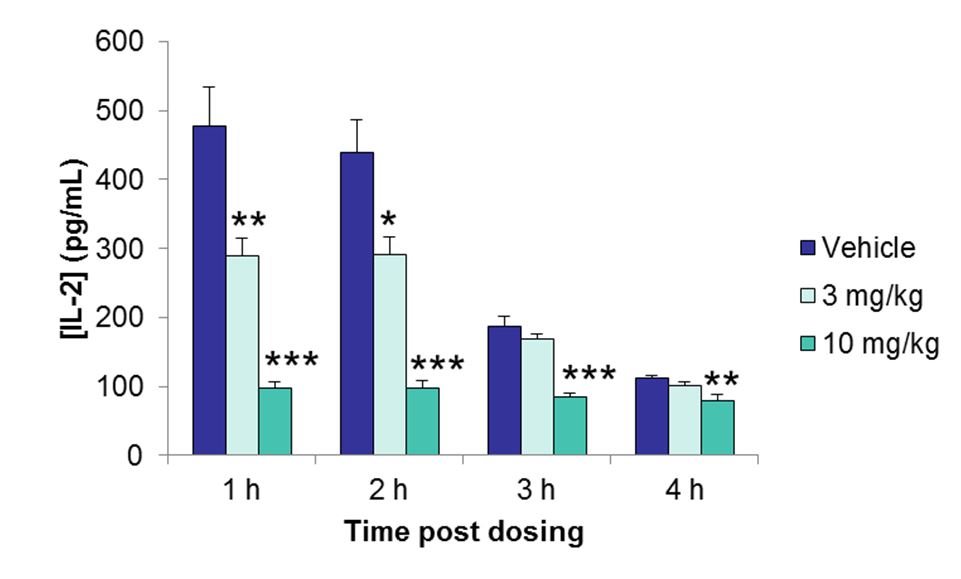
Figure: Effect of oral cyclosporin A on
anti-CD3-induced IL-2 release in the rat
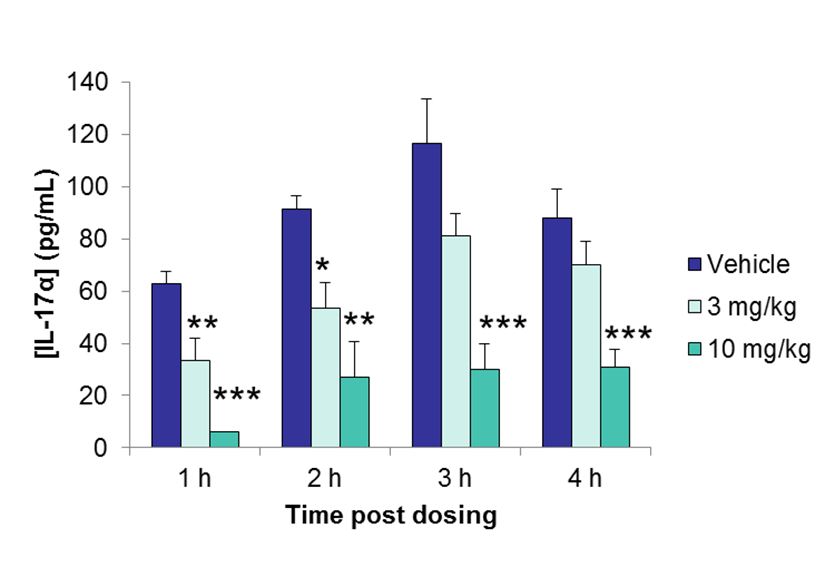
Figure: Effect of oral cyclosporin A on anti-CD3-induced IL-17 release in the rat
Data are mean ± sem, n=7. * p<0.05, ** p<0.01, *** p<0.001 significantly different from vehicle. Data analysed with one-way ANOVAs and Dunnett’s post hoc test